Project 4: Development of R-CESM and online nesting capability for CESM
Project Leaders

Kurian (TAMU)

Small (NCAR)
Project Objective
Policy makers and stakeholders have been increasingly demanding climate prediction information on regional scales at high spatial resolutions. Regional downscaling is one approach, where regional information can be provided by regional prediction systems that are forced by surface and boundary conditions from coarse resolution global climate prediction simulations. Advantages of the regional downscaling approach are its affordability and versatility. Disadvantages are dynamical consistency and errors that arise from dependency of regional models on low-resolution global model simulations as boundary condition inputs. Undoubtedly, there are many technical and scientific challenges with such regional downscaling approaches, major among them is fidelity of their results.
The objective of this research project is to test a working hypothesis that nesting a regional CESM within CESM can provide an effective means of improving simulation and prediction of weather and climate extremes and their impact at regional scales and high spatial resolutions.
Research Plan
To test this hypothesis, we will first complete the development and test of the R-CESM that couples Weather Research Forecasting (WRF) model, Regional Ocean Modeling System (ROMS) and Community Land-Surface Model (CLM) in a same manner as in its global version - CESM. A series of regional climate simulations will be conducted to understand and evaluate the impact of differences in physics parameterizations between R-CESM and CESM on simulations of weather and climate extremes with the same resolution. Understanding these issues can help us understand the differences between weather models, such as WRF, and climate models, such as CESM, and any potential issues of combining these two different types of models.
The next phase of the project is to complete the development and implementation of the Intra-Component Driver Framework (ICDF) software – that facilitates nesting higher resolution regional model components within coarser resolution global model components. Once completed and tested, we will conduct ensemble of online downscaling simulations with the nested R-CESM within CESM for climate extremes under the present and future climate conditions.
Project Time Table
Year 1
- Complete the development and test of R-CESM.
- Conduct numerical experiments to evaluate the impact of differences in physics parameterizations between R-CESM and CESM.
- Publish R-CESM results and release R-CESM code with a complete user guide.
Year 2-3
- Complete the development and implementation of the Intra-Component Driver Framework (ICDF) software.
- Conduct test experiments to verify the implementation and improve efficiency.
- Publish a paper describing the new modeling capability.
Year 4-5
- Conduct a large ensemble of downscaling simulations under the present and future climate conditions.
- Analyze the downscaling simulations and compare the results to those from the high resolution CESM simulations.
- Publish the results of downscaling simulations and comparison with the high resolution CESM simulations.
Progress and Current Status
A coupled Tropical Channel Model (TCM) has been developed. The TCM will ultimately be used for predicting climate extremes, such as tropical cyclones (TCs), on seasonal timescales. Preliminary results show that the TCM has excellent potential skills in predicting TCs at these time scales. Figure 4 shows that the hind casted TC variability on the North Atlantic (NAT), Western North Pacific (WNP) and Eastern North Pacific (ENP). As can be seen, the TCM has high skills in simulating year-to-year TC variability given the observed SSTs. More results of the TCM hindcast experiments are summarized in a journal paper submitted to Journal of Climate (Fu et al. 2019).
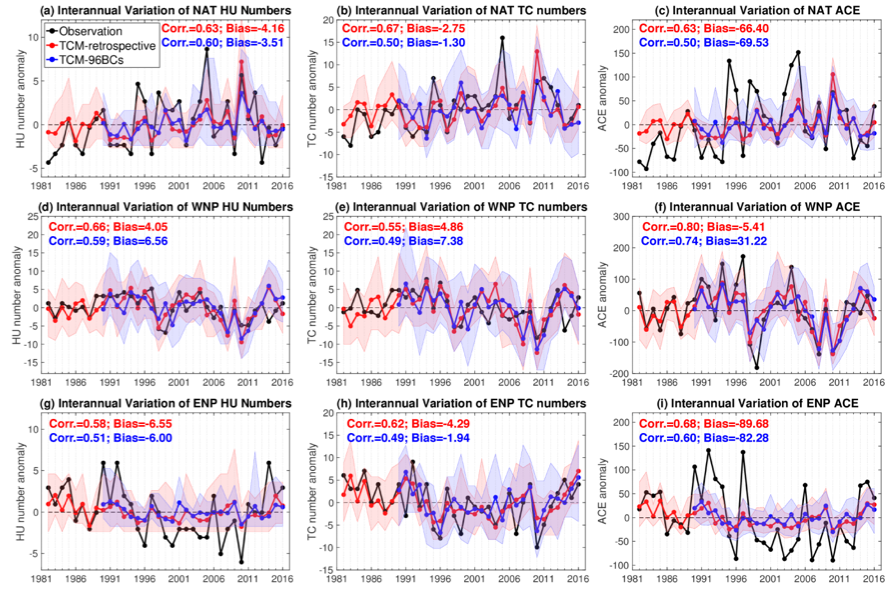
Figure 1. Time series of NAT (a) number of hurricanes, (b) number of all TCs, and (c) ACE from 1 June - 30 November from observations (black curves), the ensemble averaged TCM hindcast simulation (red curves), and the ensemble averaged TCM fixed boundary simulation (blue curves). Each time series is normalized by subtracting the corresponding climatology. The correlation and bias values listed in each panel are calculated during the period of 1990-2016. Shadings indicate the range of the minimum and maximum along the simulation ensemble members. (d), (e) and (f) are as in (a), (b) and (c) but for results in the WNP, and (g), (h), (i) for the ENP.
Research & Projects
ResearchModeling ToolsProject 1: High-resolution CESM present and future climate simulationsProject 2: High-resolution ensemble CESM decadal climate predictionProject 3: High-resolution ocean model improvement and development Project 4: Development of R-CESM and online nesting capability for CESMProject 5: Development of online coupled data assimilation capability for R-CESM and CESM
